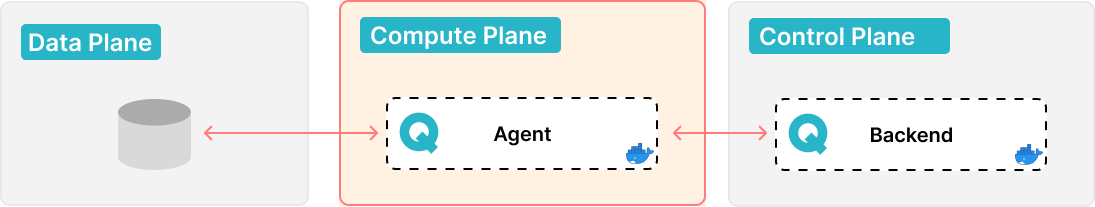
What is a pack ?
A pack is a program that executes an analysis on a data source. Packs are run by workers according to routines schedules. Its purpose is to process the source and retrieve data quality information about it to send back to the platform.
Begin with Packs
Create a Pack

To create a pack you can use the helper command in qalita cli :
- Command
- Output
qalita pack init --name my_pack
>>> qalita pack init --name my_pack
Created package folder: my_pack_pack
Created file: properties.yaml
Created file: pack_conf.json
Created file: main.py
Please update the main.py file with the required code
Created file: run.sh
Please update the run.sh file with the required commands
Created file: requirements.txt
Please update the requirements.txt file with the required packages dependencies
Created file: README.md
Please READ and update the README.md file with the description of your pack
This creates a my_pack_pack folder with the following files:
my_pack_pack
├── main.py
├── pack_conf.json
├── properties.yaml
├── README.md
├── requirements.txt
└── run.sh
| File | Description | Examples |
|---|---|---|
| main.py | Contains the pack’s code | main.py |
| pack_conf.json | Contains the pack configuration | pack_conf.json |
| properties.yaml | Contains the pack properties | properties.yaml |
| README.md | Contains the pack description | README.md |
| requirements.txt | Contains the pack dependencies | requirements.txt |
| run.sh | Entry point of the pack | run.sh |
Test a pack
You can test your pack locally before publishing it on the platform.
To do so, use qalita cli
qalita pack validate -n my_pack
qalita pack run -n my_pack
Publish a pack
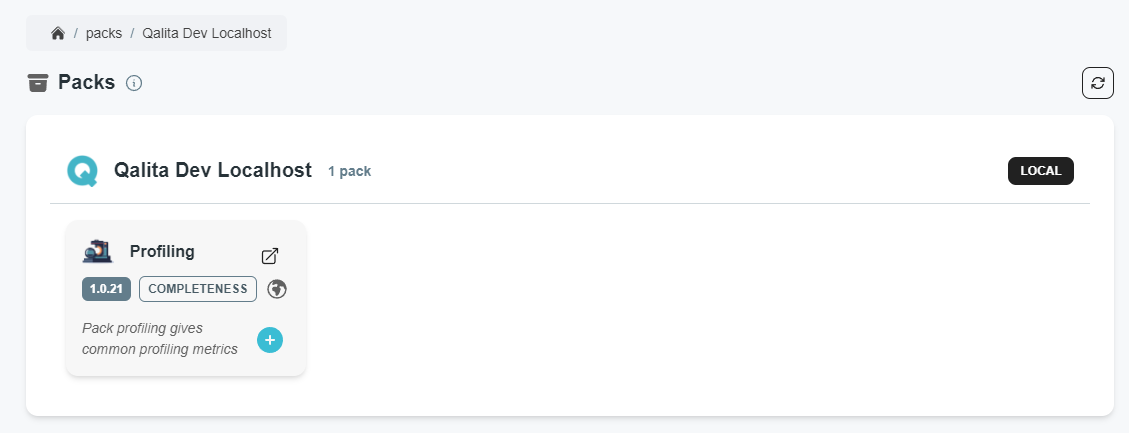
Packs have authors, you can only publish a pack you authored. You can see the author of a pack on its pack page:
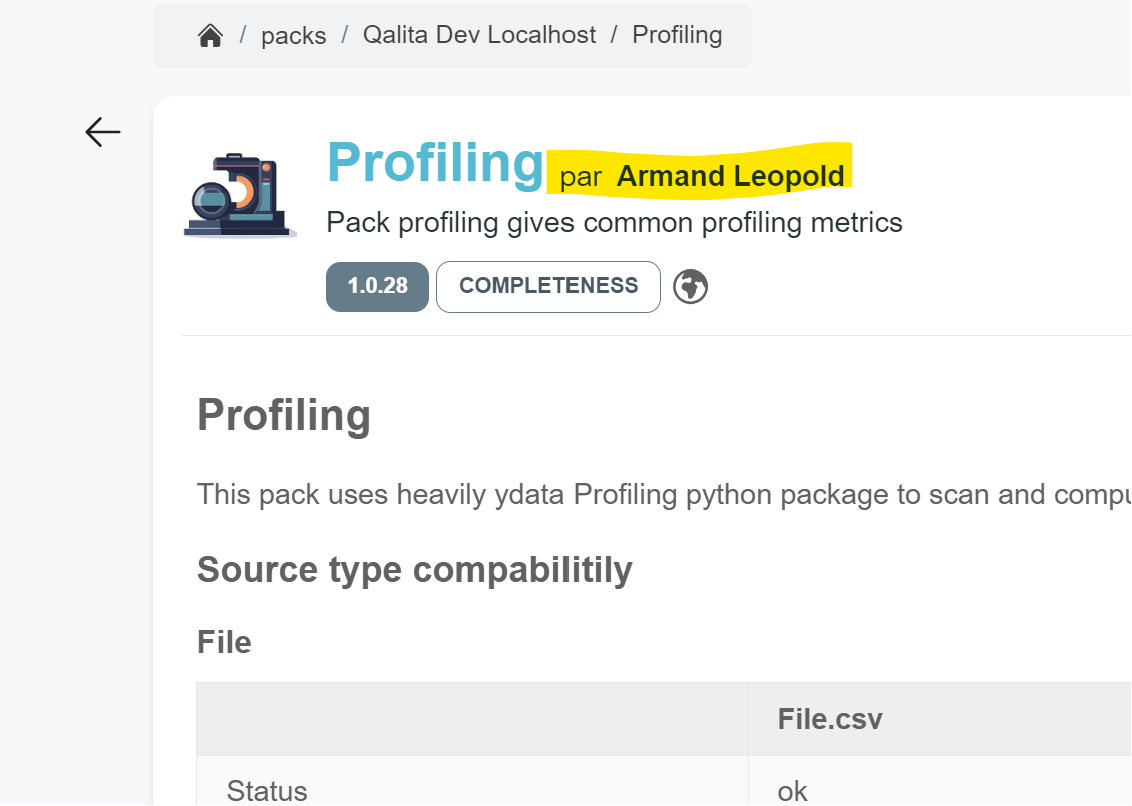
Viewing the author of a pack
To publish a pack you must use the QALITA CLI:
- Install the QALITA CLI
pip install qalita
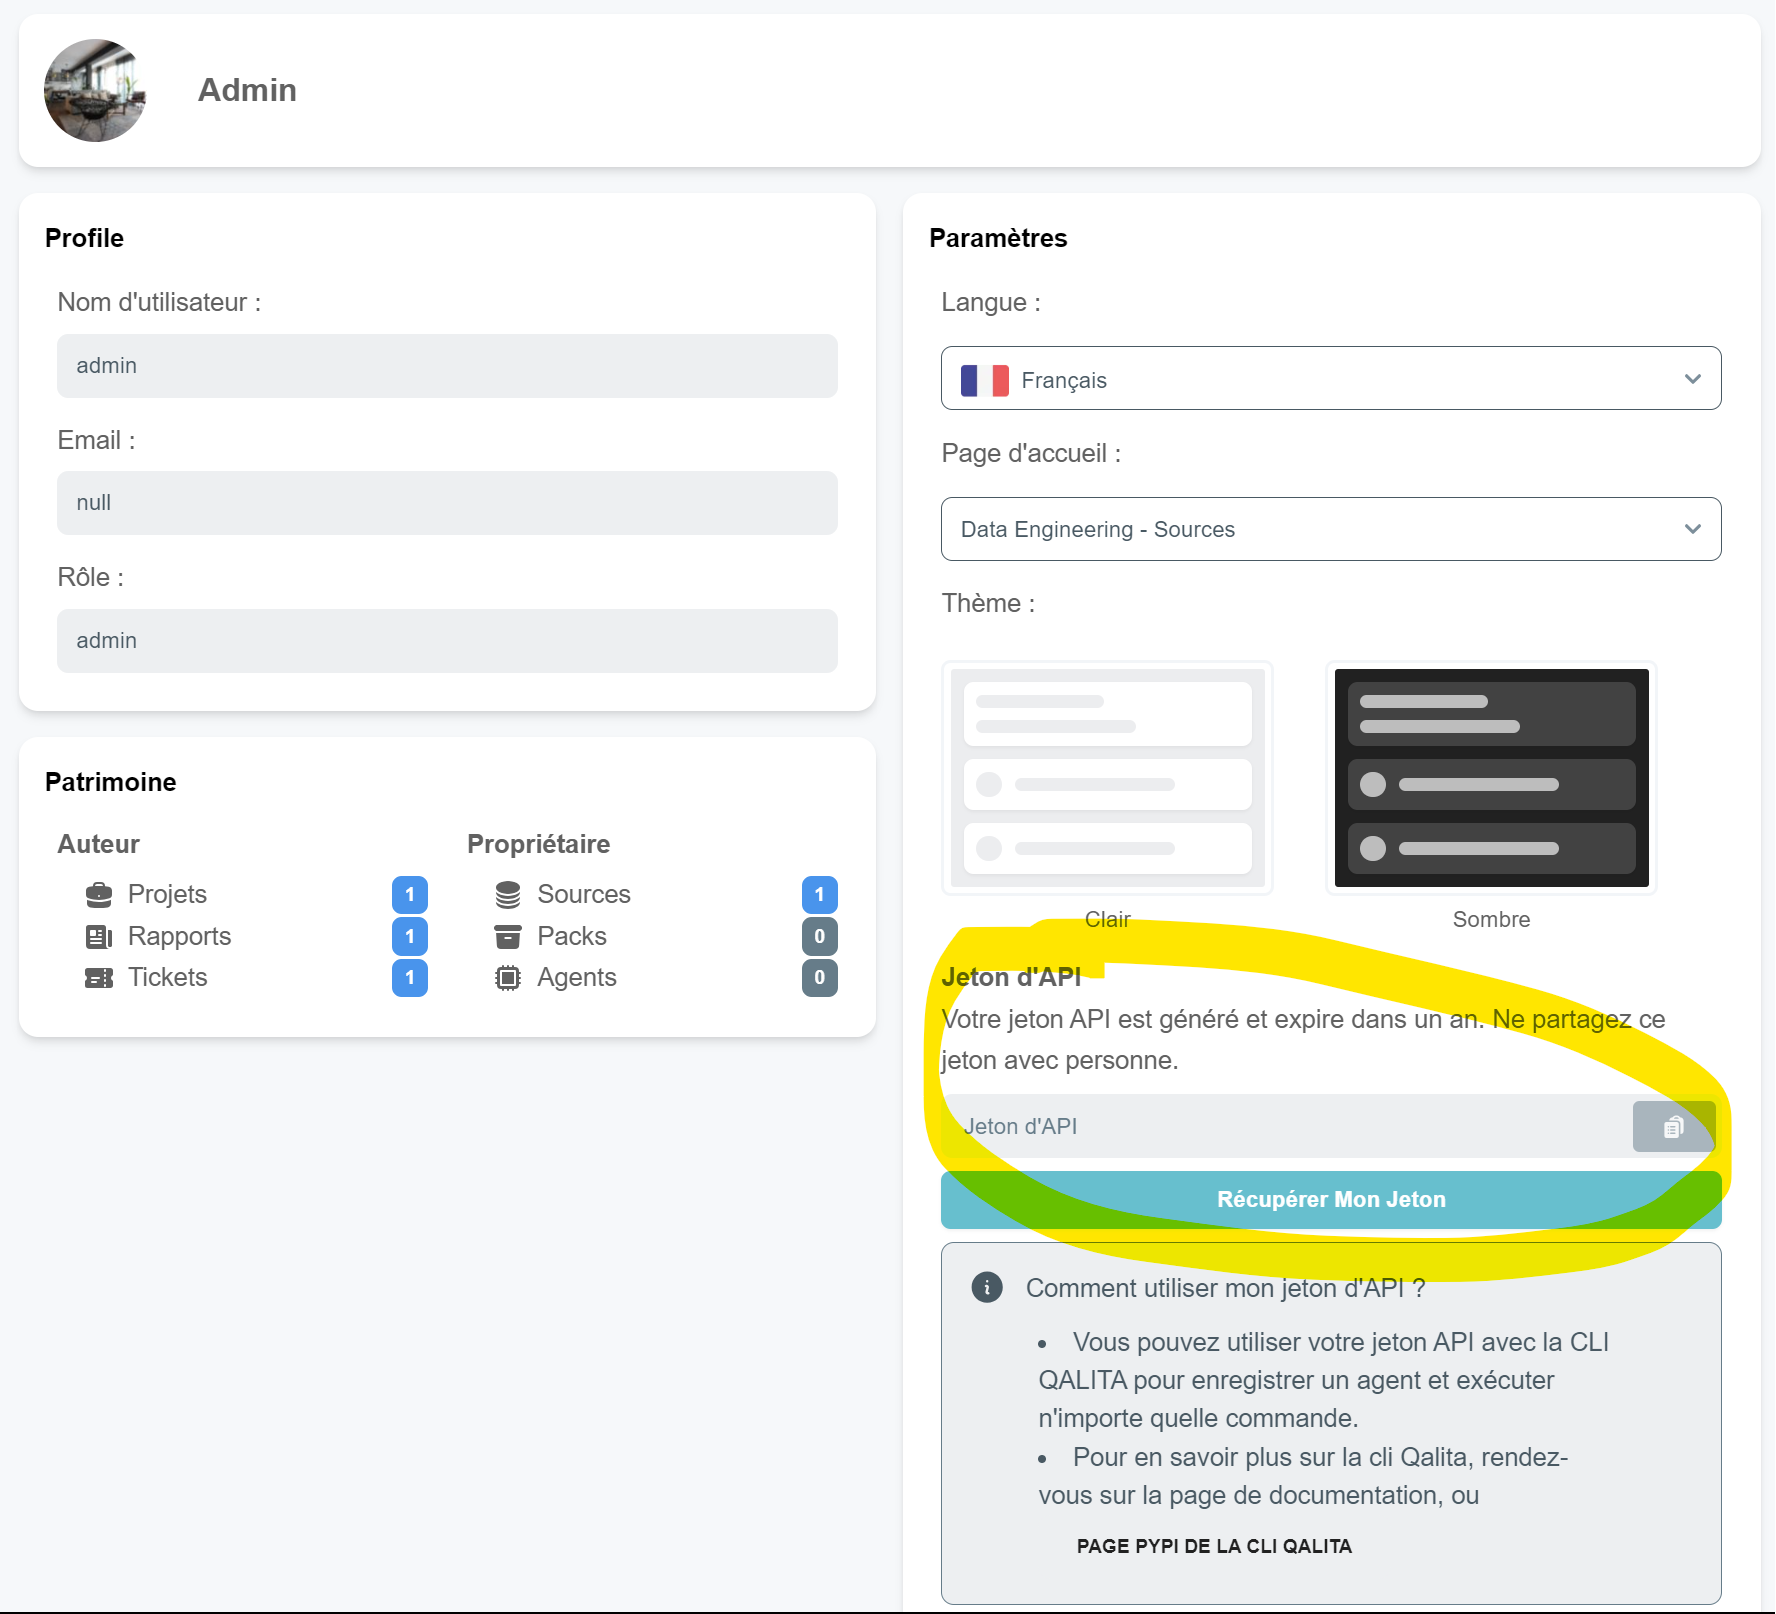
- Retrieve your API token from your profile page
- Connect to the platform
agentName=admin
fileName="$HOME/.qalita/.env-$agentName"
mkdir -p $(dirname $fileName)
echo "QALITA_AGENT_NAME=$agentName" > $fileName
echo "QALITA_AGENT_MODE=worker" >> $fileName
echo "QALITA_AGENT_ENDPOINT=http://localhost:3080" >> $fileName
echo "QALITA_AGENT_TOKEN=" >> $fileName
- Go to the parent folder of the pack
Example for a pack named my-pack:
/-- parent-folder <----- here
   |-- my-pack_pack
   |   |-- __init__.py
   |   |-- my-pack.py
- Publish the pack
- Command
- Output
qalita pack push -n my_pack
>>> qalita pack push -n my_pack
------------- Pack Validation -------------
Pack [my_pack] validated.
------------- Pack Push -------------
Pack [my_pack] published
New pack version [1.0.0] detected. Pushing pack version
Pack [my_pack] updated successfully
Pack asset uploaded
Pack pushed !
You can then find your pack on the platform:
During execution
The pack’s entry point is the run.sh file located in the root path of the temporary local folder created by the agent. For windows, it's the run.bat file.
Example:
#/bin/bash
python -m pip install --quiet -r requirements.txt
python main.py
The pack is provided with a source_conf.json file, and also a target_conf.json if the pack is of type compare.
These files contain the source config: data.
They are located next to the run.sh entry point.
Example:
{
  "config": {
    "path": "/home/lucas/desktop"
    // rest of the config for other sources type, like databases.
    // ....
  },
  "description": "Desktop files",
  "id": 1,
  "name": "local_data",
  "owner": "lucas",
  "type": "file",
  "reference": false,
  "sensitive": false,
  "visibility": "private",
  "validate": "valid"
}
Analysis Results
At the end of the pack’s execution, the agent looks for :
| File | Description |
|---|---|
| logs.txt | Log file providing feedback to the platform |
| schemas.json | Schema detected or analyzed by the pack |
| recommendations.json | Recommendations generated by the pack |
| metrics.json | Metrics results produced by the pack |
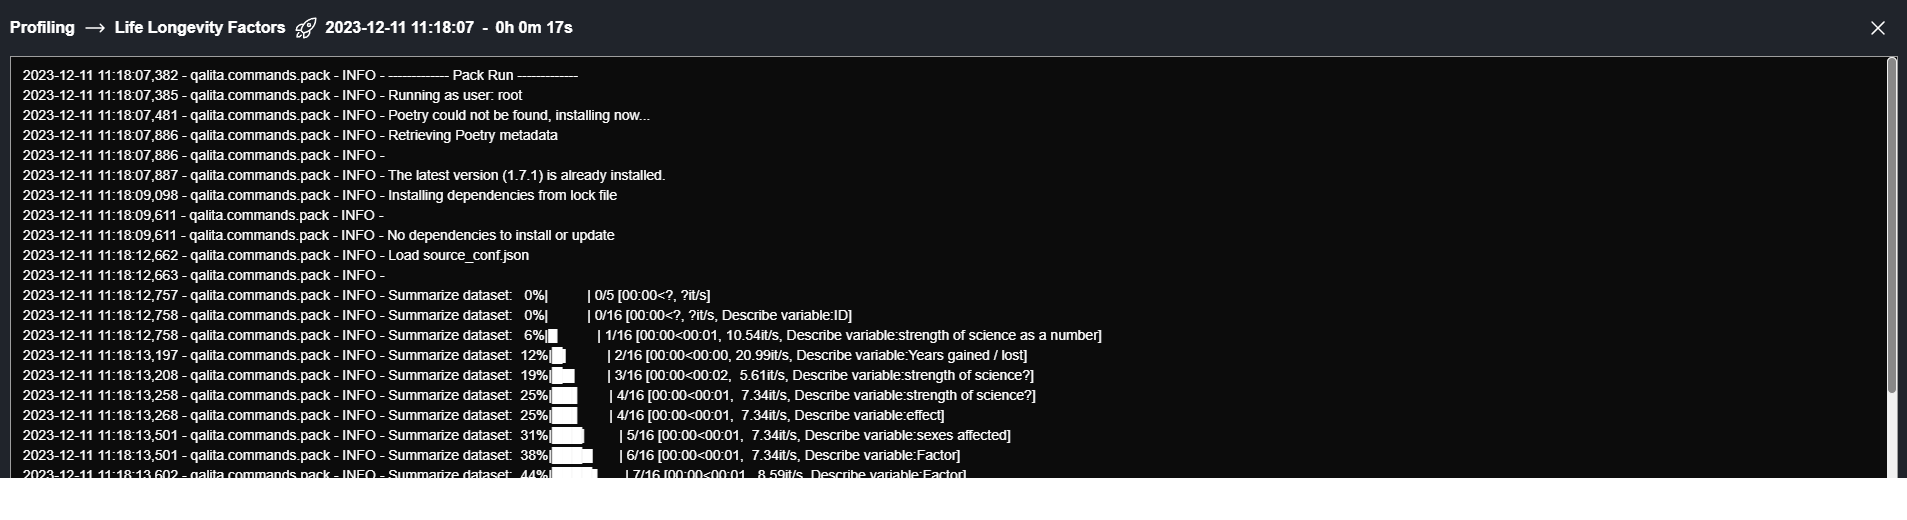
Logs
logs.txt : File uploaded to provide feedback logs to the platform frontend.
2023-07-21 11:51:12,688 - qalita.commands.pack - INFO - ------------- Pack Run -------------
2023-07-21 11:51:15,087 - qalita.commands.pack - INFO - CSV files found:
2023-07-21 11:51:15,222 - qalita.commands.pack - ERROR - Summarize dataset :   0%| | 0/5 [00:00` ?, ?it/s]
...
Visible on the platform :
Schema
schemas.json : This file contains the schema information provided by the pack about the source.
schemas.json Example:
[
    {
        "key": "dataset",
        "value": "Heart Failure Prediction Dataset",
        "scope": {
            "perimeter": "dataset",
            "value": "Heart Failure Prediction Dataset"
        }
    },
    {
        "key": "column",
        "value": "Age",
        "scope": {
            "perimeter": "column",
            "value": "Age"
        }
    },
    {
        "key": "column",
        "value": "Sex",
        "scope": {
            "perimeter": "column",
            "value": "Sex"
        }
    },
    ....
]
Schemas are then displayed in the pack view on the source page.
Schema Parent Scope
Schemas can be chained using heritage with the parent_scope attribute, for example, a scope of value column can have a parent_scope named table with value my_table.
    {
        "key": "column",
        "value": "age",
        "scope": {
            "perimeter": "column",
            "value": "age",
            "parent_scope": {
                "perimeter": "dataset",
                "value": "Medical Cost Personal Datasets_1"
            }
        }
    },
    {
        "key": "dataset",
        "value": "Medical Cost Personal Datasets_1",
        "scope": {
            "perimeter": "dataset",
            "value": "Medical Cost Personal Datasets_1"
        }
    }
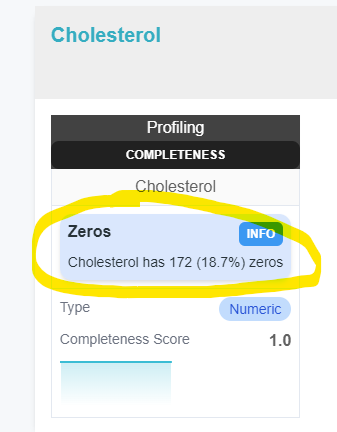
Recommendation
recommendations.json : This file contains the recommendations given by the pack about the source.
{
    [
        {
            "content": "Cholesterol has 172 (18.7%) zeros",
            "type": "Zeros",
            "scope": {
                "perimeter": "column",
                "value": "Cholesterol"
            },
            "level": "info"
        },
        {
            ...
        }
        ...
    ]
}
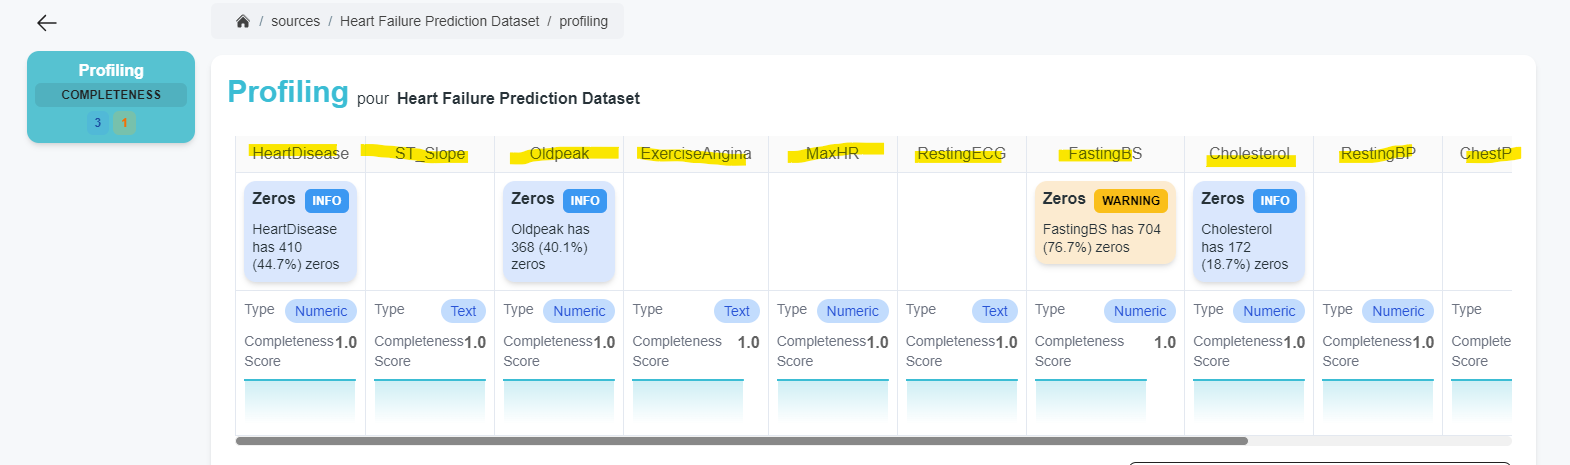
Recommendations are then displayed in the pack view on the source page.
Metrics
metrics.json : This file contains the metrics provided by the pack about the source.
metrics.json Example:
{
    [
        {
            "key": "completeness_score",
            "value": "1.0",
            "scope": {
                "perimeter": "dataset",
                "value": "Heart Failure Prediction Dataset"
            }
        },
        {
            ...
        }
        ...
    ]
}
Metrics are then displayed in the pack view on the source page using pack's chart configuration
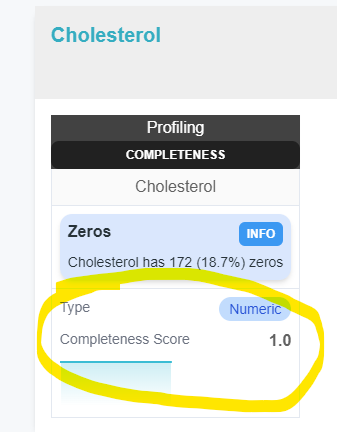
Metrics and recommendations are sent to the platform and are then available in the pack execution view of the source.
External Output Analytics Files
During pack execution you can produce files that can contains more data related to your analysis, such as more detailed analytics reports, output files containing matches or missmatches, outliers etc... Theses files can be accessed when running the agent cli with the UI enabled on the agent panel :
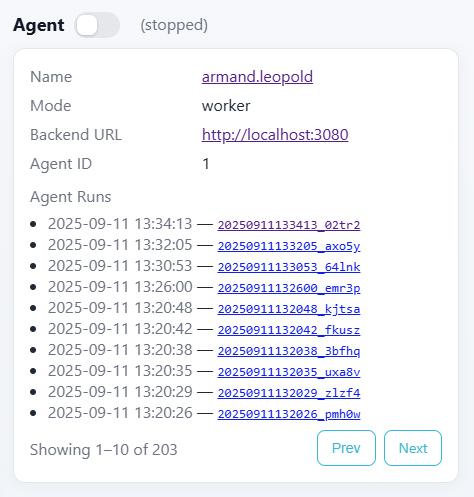
You can then click on the [Agent Runs] to open the folders contaning all the files used during pack runs, including all output files.
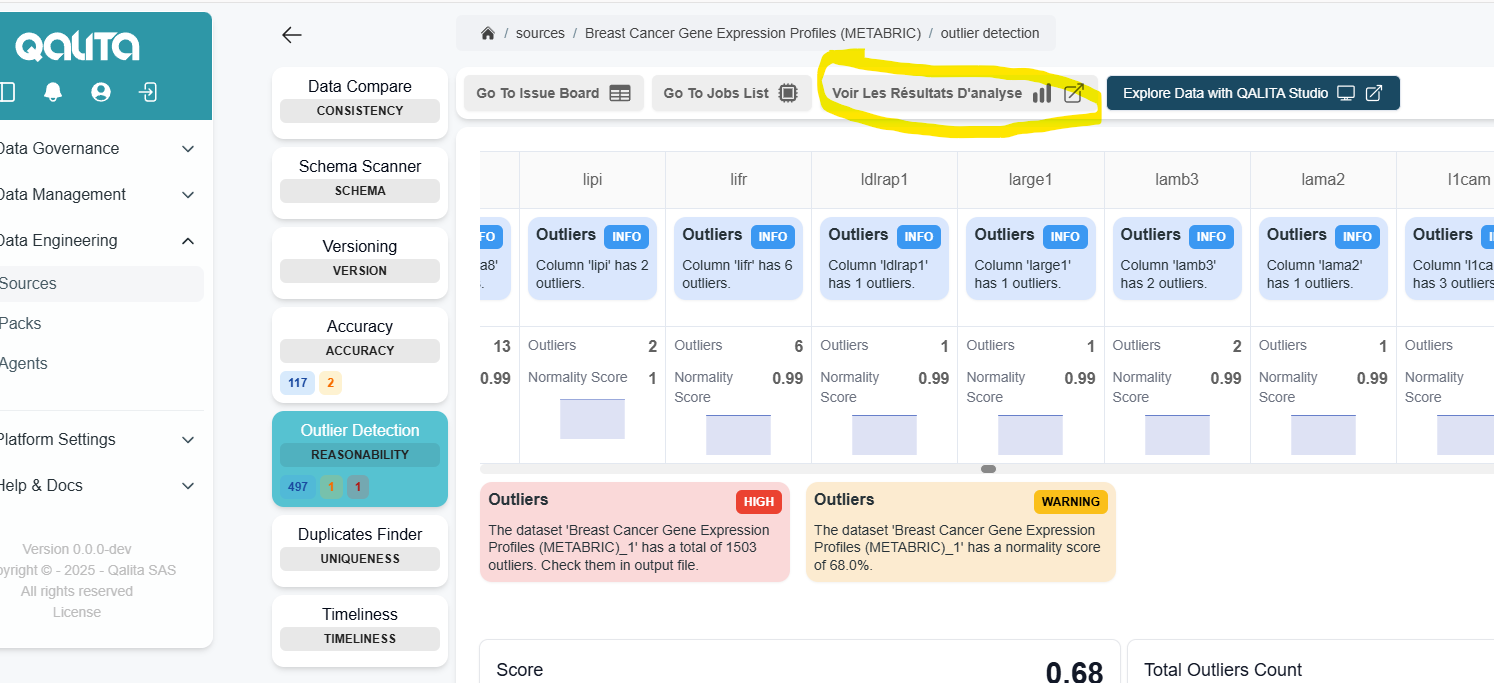
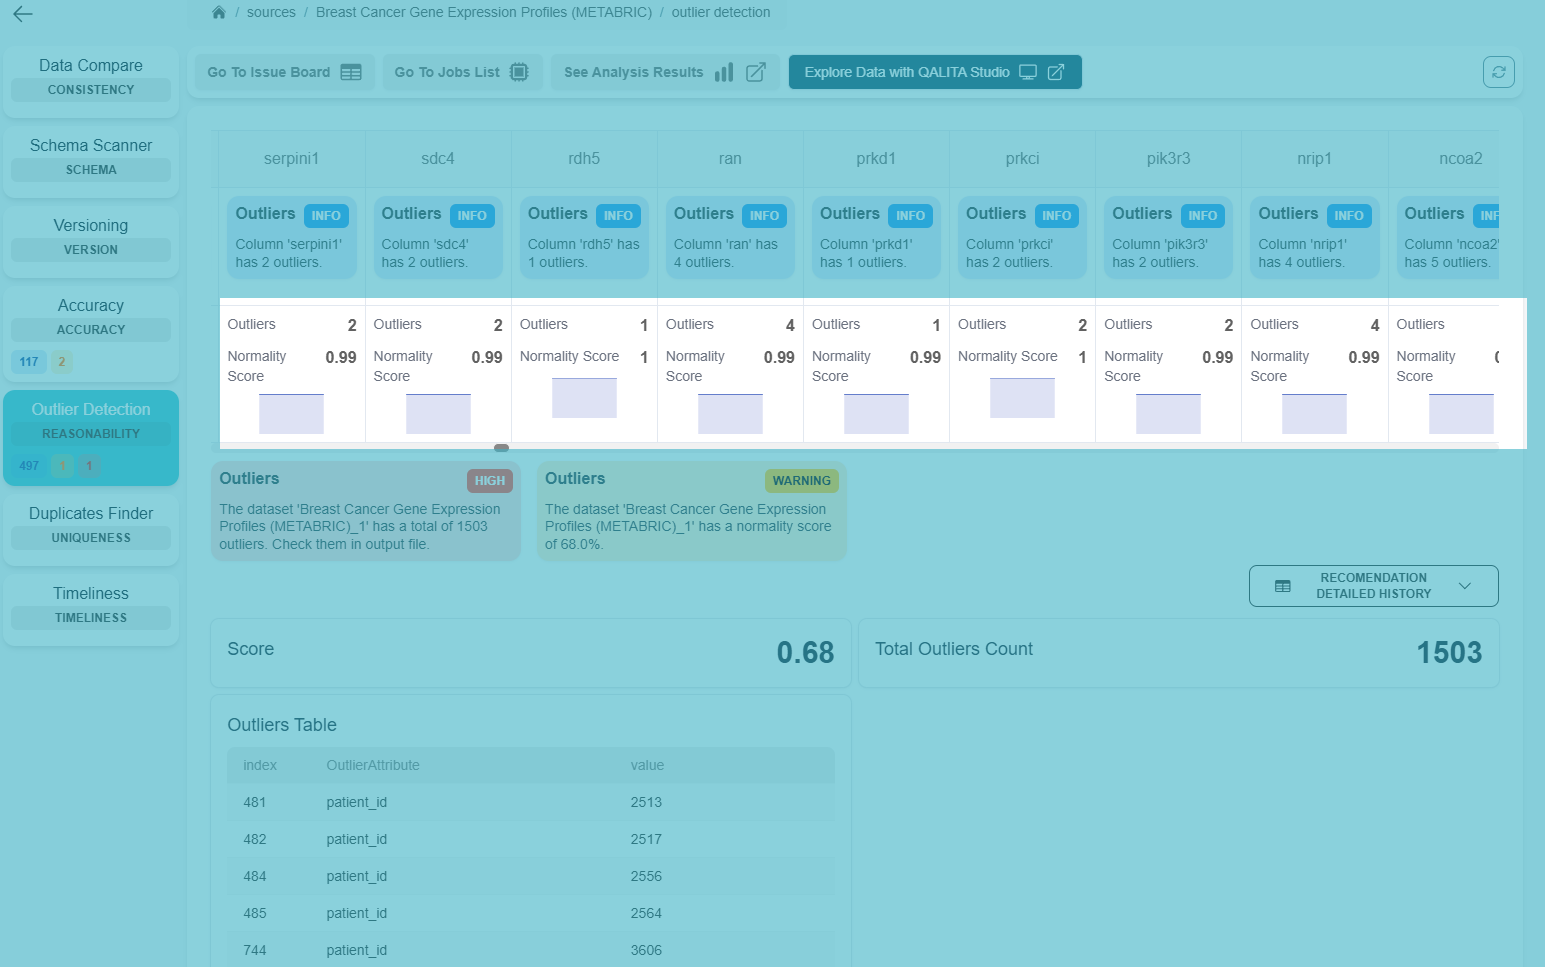
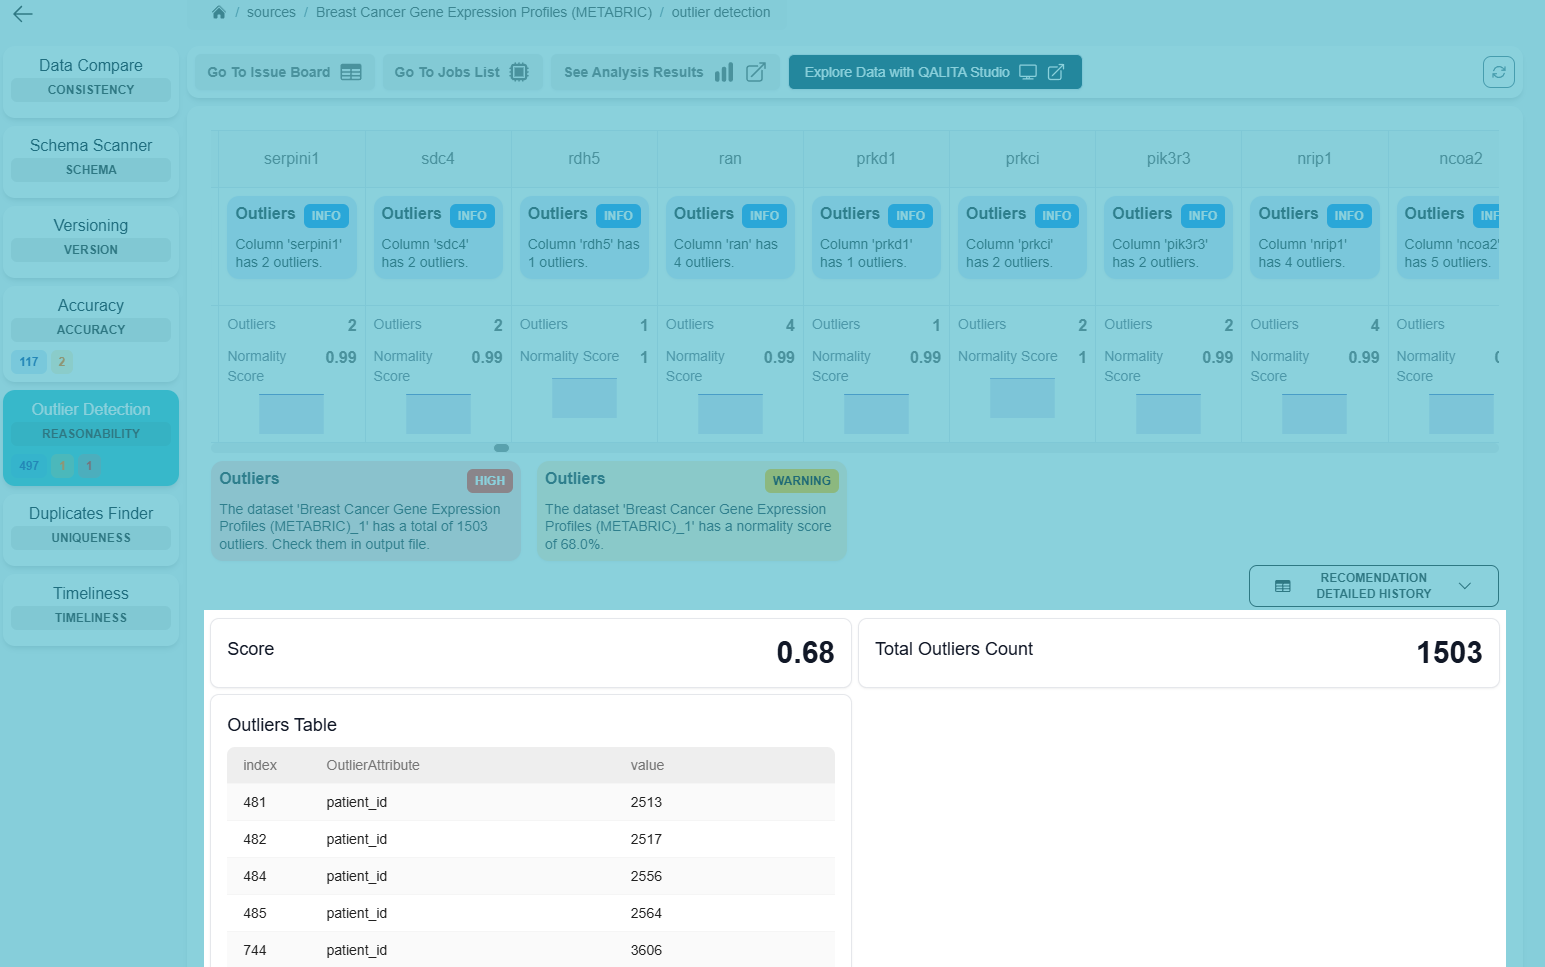
On Platform on a Pack Report on the source page you can click to [See Analysis Results]
Pack Charts
Charts allow you to format and visualize the metrics produced by packs.
Basic configuration
There are two areas where charts are used :
Scoped
Scoped charts will display data related to a specific scope, in this example it's a column from a dataset.
    "charts": {
        "scoped": [
            {
                "chart_type": "text",
                "metric_key": "outliers",
                "display_title": true,
                "justify": true
            },
            {
                "chart_type": "text",
                "metric_key": "normality_score",
                "display_title": true,
                "justify": true
            },
            {
                "chart_type": "spark_area_chart",
                "metric_key": "normality_score",
                "display_title": false
            }
        ]
    }
Overview
Overview charts will display data on the source pack's results metrics panel :
    "charts": {
        "overview": [
            {
                "chart_type": "text",
                "metric_key": "score",
                "display_title": true,
                "justify": true
            }
        ],
    }
You can combine both scoped and overview config :
    "charts": {
        "overview": [
            {
                "chart_type": "text",
                "metric_key": "score",
                "display_title": true,
                "justify": true
            }
        ],
        "scoped": [
            {
                "chart_type": "badge",
                "metric_key": "type",
                "display_title": true,
                "justify": true
            },
            {
                "chart_type": "text",
                "metric_key": "completeness_score",
                "display_title": true,
                "justify": true
            },
            {
                "chart_type": "spark_area_chart",
                "metric_key": "completeness_score",
                "display_title": false
            }
        ]
    }
Detailed parameters
| Json | Display | Exemple |
|---|---|---|
chart_type | Component type (ECharts) to render | "chart_type": "text" |
metric_key | Name of the metric to display (category/value) | "metric_key": "completeness_score" |
display_title | Display the title (derived from metric_key) | "display_title": true/false |
justify | Align the title and the badge/text | "justify": true/false |
tooltip | Tooltip with title and content | { "title": "Rows", "content": "Number of processed rows" } |
chart_config | Options specific to the visual type, see bellow for more details | {} |
Where to place the JSON configuration?
In the Pack's default configuration
Since the pack creator is the best positioned to know how to properly display the metrics produced by their pack, they can propose a default chart configuration.
./`pack-name`_pack/
    /run.sh
    /README.md
    /properties.yaml
    /main.py
    /config.json  # << The config file of your pack, you can use it to set any configurations you like
    /requirements.txt
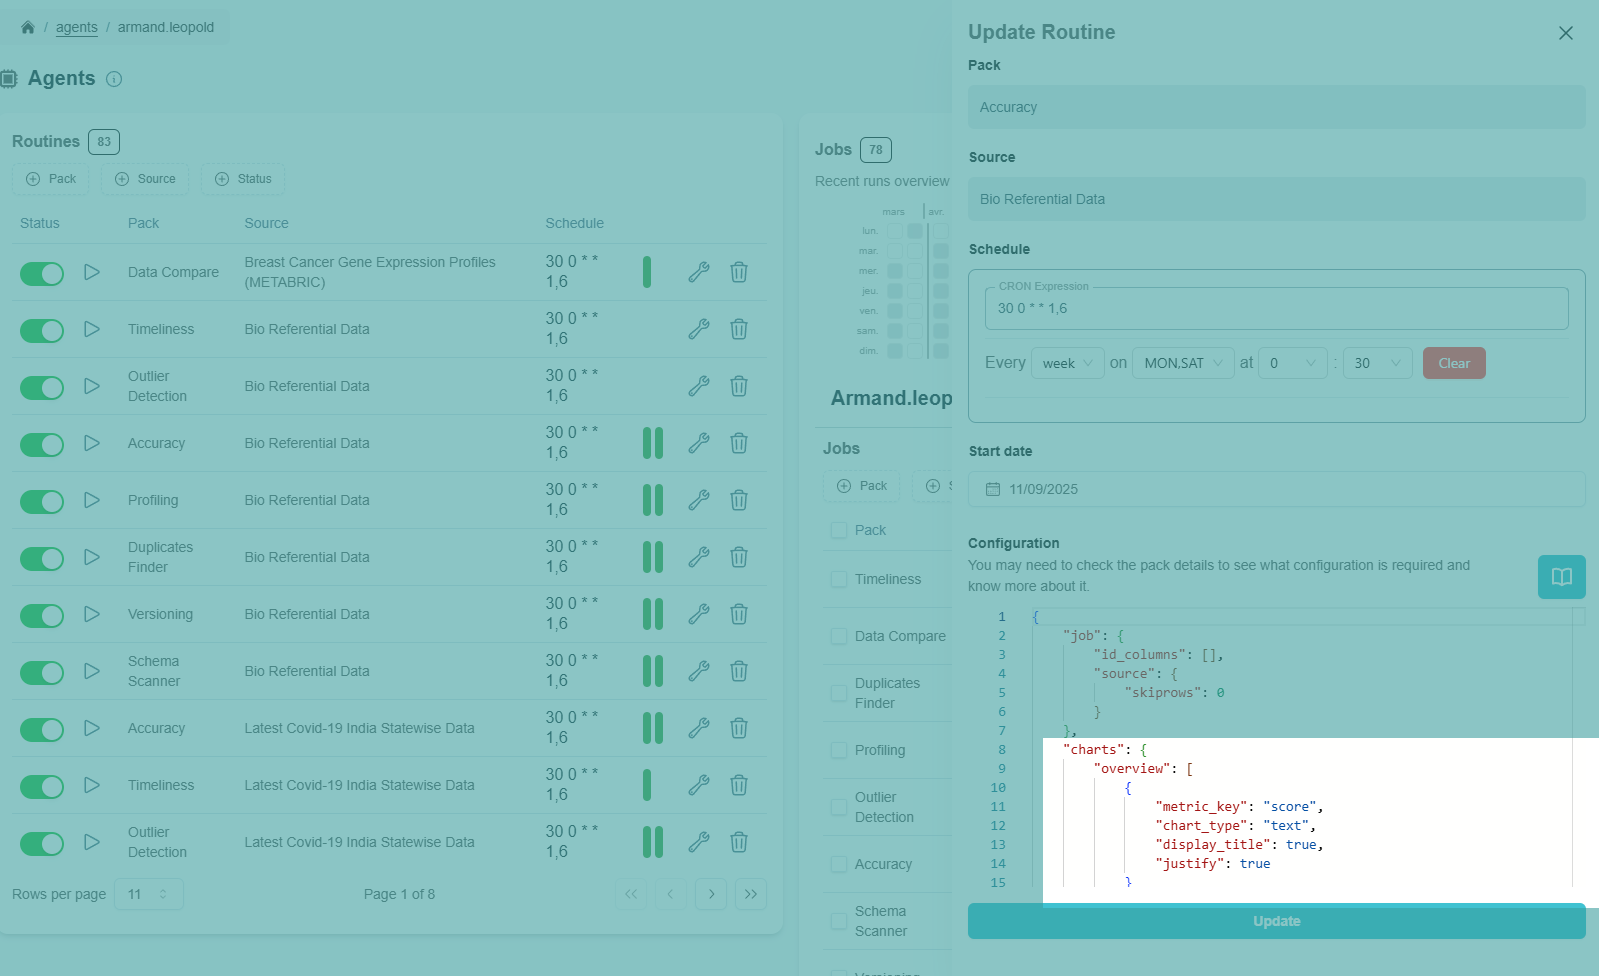
By overriding the configuration in a routine
Because each source is different, you may want to adapt the visuals with metrics that seem more relevant for certain sources. For this, you can adjust the configuration when creating a routine for a source with a pack. This configuration can be modified at any time.
Supported visual types and options
Time series
| Chart | Render |
|---|---|
line_chart |
|
area_chart |
|
bar_chart |
|
donut_chart |
|


-
chart_config.colors?: list of Tailwind colors (e.g.indigo,emerald,cyan) -
Compact variants:
spark_line_chart,spark_area_chart,spark_bar_chart(reduced display)
Categories/indicators
text,badge(render the last metric value)table,recommendation_level_indicator
calendar_heatmapchart_config.range?: year e.g."2025"or["2025-01-01","2025-12-31"]chart_config.min?/max?chart_config.colors?: gradient from lowest to highest (e.g.["#eef2ff","#3b82f6"])chart_config.cellHeight?: cell height (default 18)

radar_chartchart_config.label_key: label key (e.g."label")chart_config.categories: list of axes (e.g.["quality","freshness","coverage"])chart_config.data: array of one or more objects, e.g.[ { "label": "Score", "quality": 0.8, "freshness": 0.6, "coverage": 0.9 } ]chart_config.colors?: palette;chart_config.showLegend?
![]()
treemap_chartchart_config.data: hierarchical data{ name, value?, children? }[]

sunburst_chartchart_config.data: hierarchical data{ name, value?, children? }[]

sankey_chartchart_config.nodes:{ name }[]chart_config.links:{ source, target, value }[]
![]()
boxplot_chartchart_config.categories: box names (x-axis)chart_config.samples: samples per categorynumber[][]chart_config.color?: main color
When a visual has no data, a “No Data” placeholder is automatically displayed with a light gray border and a minimum height to maintain layout stability.
Quick examples
1) Line chart (time series)
{
  "chart_type": "line_chart",
  "metric_key": "error_rate",
  "display_title": true,
  "tooltip": { "title": "Errors", "content": "Error rate per minute" },
  "chart_config": { "colors": ["rose"] }
}
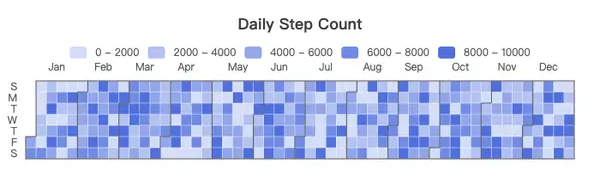
2) Calendar heatmap (daily activity)
{
  "chart_type": "calendar_heatmap",
  "metric_key": "events",
  "display_title": true,
  "chart_config": {
    "range": "2025",
    "colors": ["#eef2ff", "#3b82f6"],
    "cellHeight": 18
  }
}
3) Treemap (category distribution)
{
  "chart_type": "treemap_chart",
  "display_title": true,
  "chart_config": {
    "data": [
      {
        "name": "Databases",
        "children": [
          { "name": "Postgres", "value": 12 },
          { "name": "Snowflake", "value": 7 }
        ]
      }
    ]
  }
}
4) Sankey (flows)
{
  "chart_type": "sankey_chart",
  "display_title": true,
  "chart_config": {
    "nodes": [{ "name": "Source" }, { "name": "Datalake" }, { "name": "DB" }],
    "links": [
      { "source": "Source", "target": "Datalake", "value": 100 },
      { "source": "Datalake", "target": "DB", "value": 60 }
    ]
  }
}
5) Boxplot (distribution)
{
  "chart_type": "boxplot_chart",
  "display_title": true,
  "chart_config": {
    "categories": ["Job A", "Job B", "Job C"],
    "samples": [
      [100, 110, 95, 140, 120],
      [80, 90, 85, 100, 95],
      [130, 150, 160, 140, 135]
    ],
    "color": "indigo"
  }
}
Best practices
- Use clear and stable
metric_keynames (e.g.rows_processed,error_rate). - Limit the number of visuals per page to maintain readability.
- Use
tooltipto provide context for each chart. - For hierarchical visuals (treemap/sunburst), stick to 2–3 levels max.
Online Packs Resources
QALITA Platform comes with general use-cases Packs, like profiling, and outliers detections, to create your own packs, you can find online public and free ressources like a ChatGPT - Pack assistant aware of qalita pack's standards to Github QALITA Managed Pack Repo and explore public community packs at our HUB
ChatGPT - Pack Assistant
You can use our conversational bot QALITA Pack Assistant to help you in creating packs.
Our bot has a knowledge base specific to the QALITA pack creation use case. It will guide you and optimize your productivity.

GitHub
You can find QALITA’s public packs on our GitHub repository. These packs are maintained by QALITA SAS and the community. All contributions are welcome.
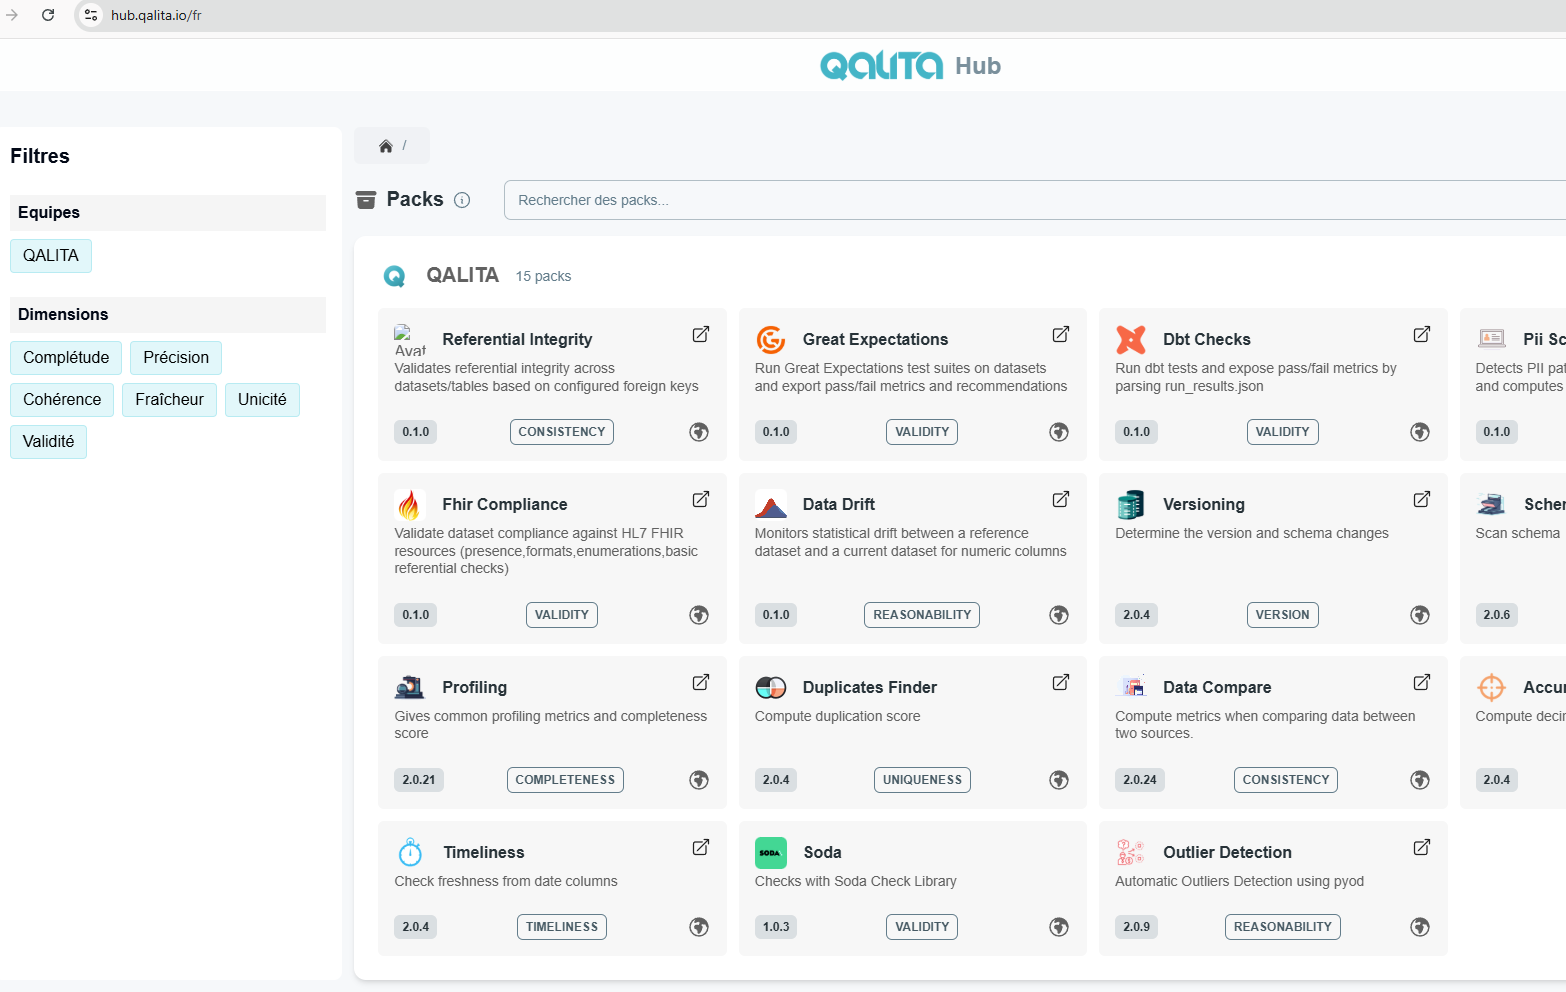
qalita.io/hub
You can also learn more and search for all public cloud platform packs on the QALITA Hub