Dashboard
The Data Governance Dashboard provides a comprehensive view of your organization's data quality posture. It allows you to visualize the status of your sources, track key performance indicators, and monitor governance activities.
The dashboard is organized into three tabs: Coverage, Monitoring & Alerting, and Compliance.
Coverage
The Coverage tab gives you an overview of how well your data quality is being assessed across your organization.
Key Metrics
- Global Coverage: The percentage of your data sources that have been assessed by quality packs.
- Coverage Matrix: A cross-reference view of data quality dimensions (completeness, accuracy, validity, etc.) against your sources, showing which dimensions are covered for each source.
- Packs by Dimension: Distribution of quality packs across the 11 data quality dimensions (completeness, accuracy, validity, timeliness, uniqueness, consistency, reasonability, schema, version, interoperability, consent).
- Sources at Risk: Sources that lack sufficient quality pack coverage or have consistently low quality scores.
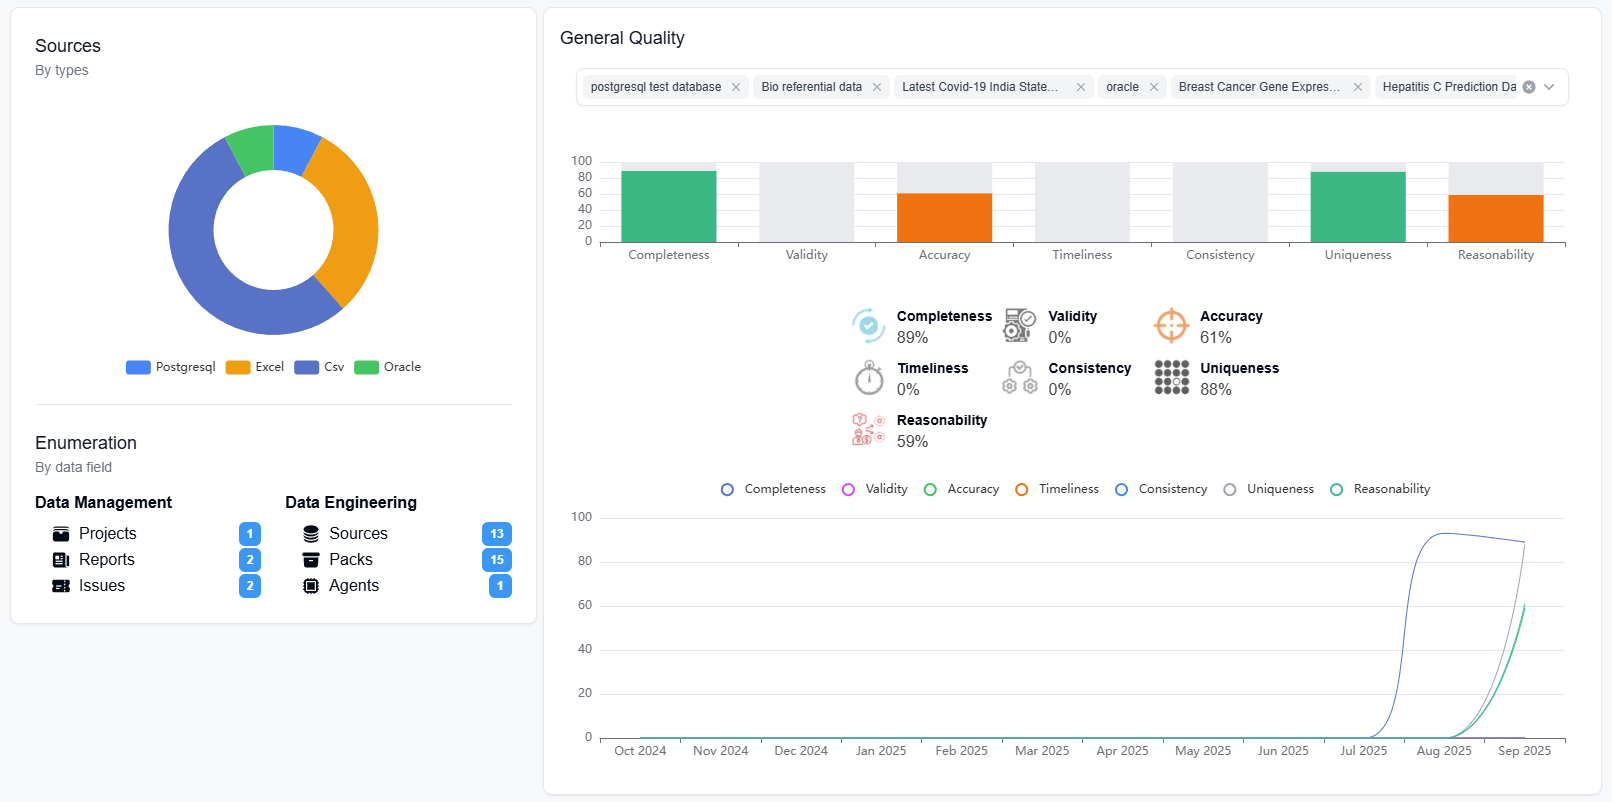
Overview of data quality on multiple data sources
Monitoring & Alerting
The Monitoring & Alerting tab tracks the operational aspects of your data quality management.
Alerts
- Total Alerts: The total number of quality alerts raised.
- Alerts by Severity: Breakdown of alerts by severity level (critical, warning, info).
- Resolution Time: Average time taken to resolve alerts.
- Alert History: Timeline of alert creation and resolution.
Recommendations
- Total Recommendations: Number of improvement recommendations generated by packs.
- Recommendations by Level: Distribution by priority level.
- Resolution Rate: Percentage of recommendations that have been addressed.
- Recommendations by Type: Categorization of recommendation types.
- Top Sources: Sources with the most recommendations, indicating areas needing attention.
Tickets
- Total Tickets: Number of data quality issues tracked.
- Tickets by Status: Distribution across statuses (open, in progress, resolved, closed).
- Resolution Time: Average time to resolve tickets.
- Tickets by Assignee: Workload distribution across team members.
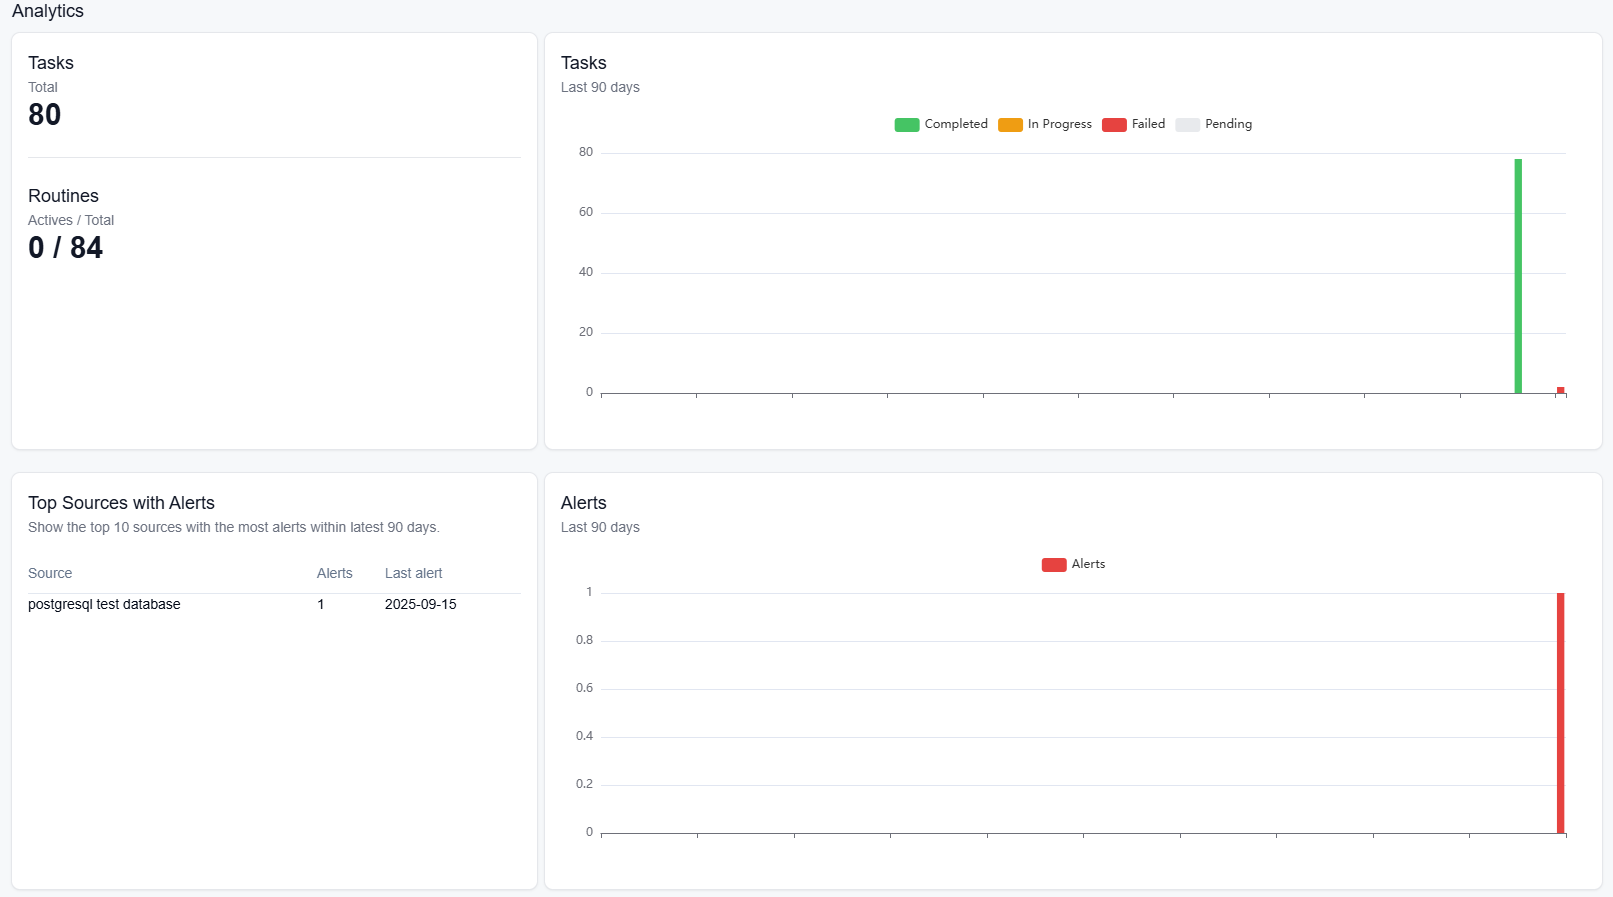
KPI metrics on analytics, Jobs, routines, alerts
Compliance
The Compliance tab provides an overview of your organization's adherence to regulatory and industry standards.
The Compliance tab is currently under development. It will provide tracking for the following frameworks:
- GDPR (General Data Protection Regulation)
- HIPAA (Health Insurance Portability and Accountability Act)
- SOC 2 (Service Organization Control 2)
- ISO 27001 (Information Security Management)
- PCI DSS (Payment Card Industry Data Security Standard)
- CCPA (California Consumer Privacy Act)
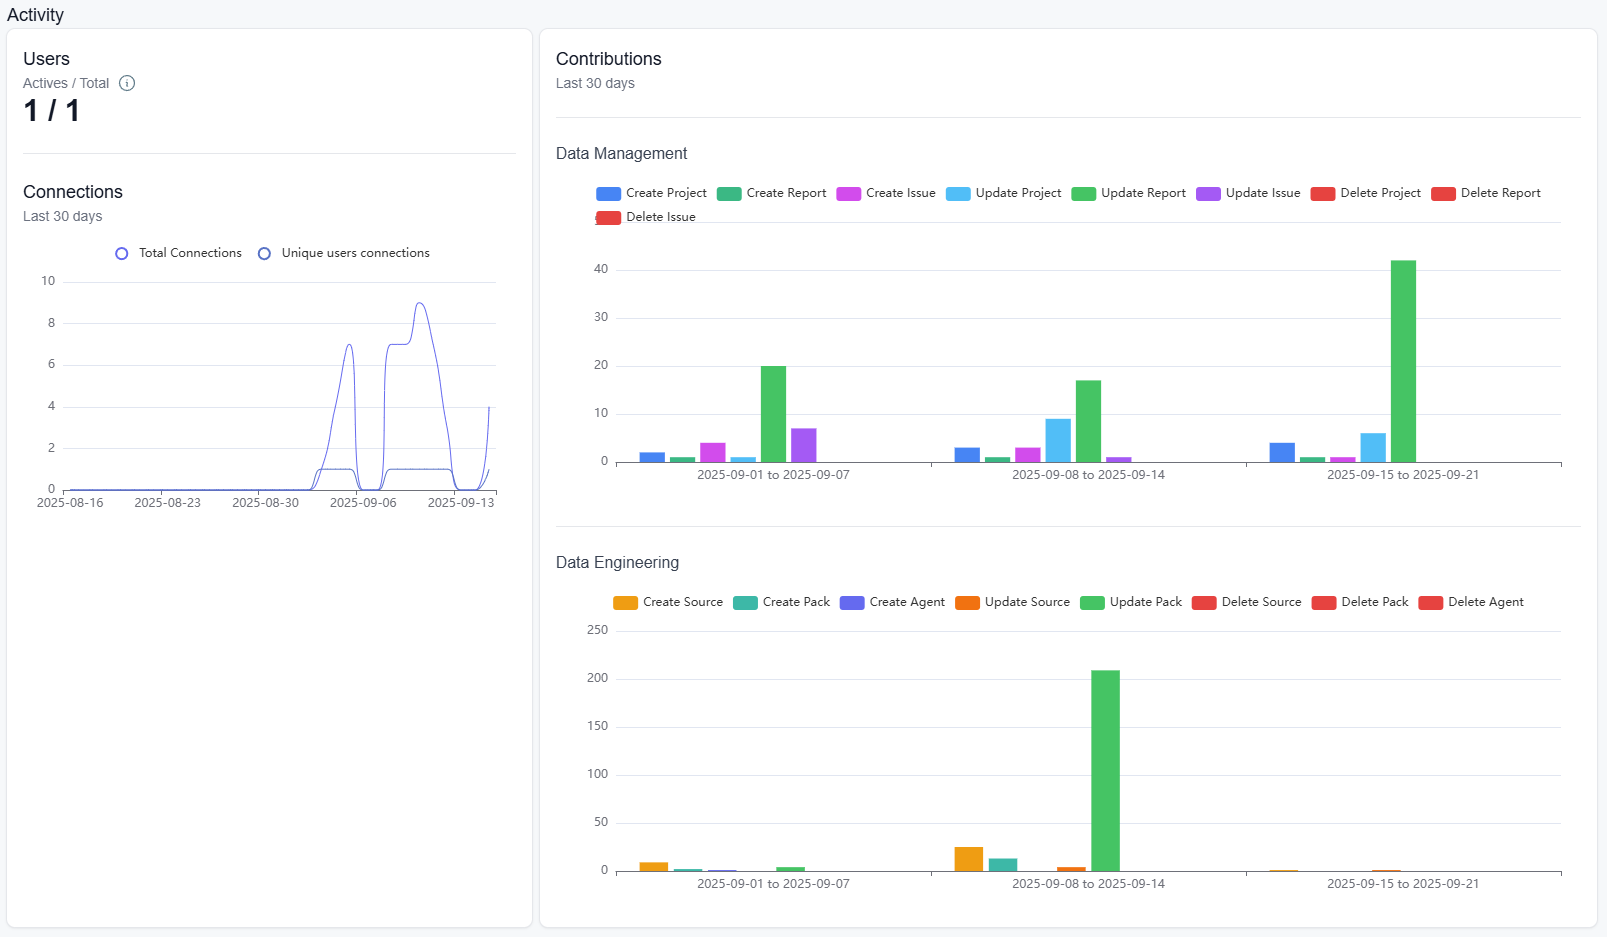
KPI metrics on user activity, Projects, issues, sources, reports, packs, workers